· Timothy O'Brien
Stop Building Dashboards
The dataset is the deliverable. The dashboard is extra credit — for show.
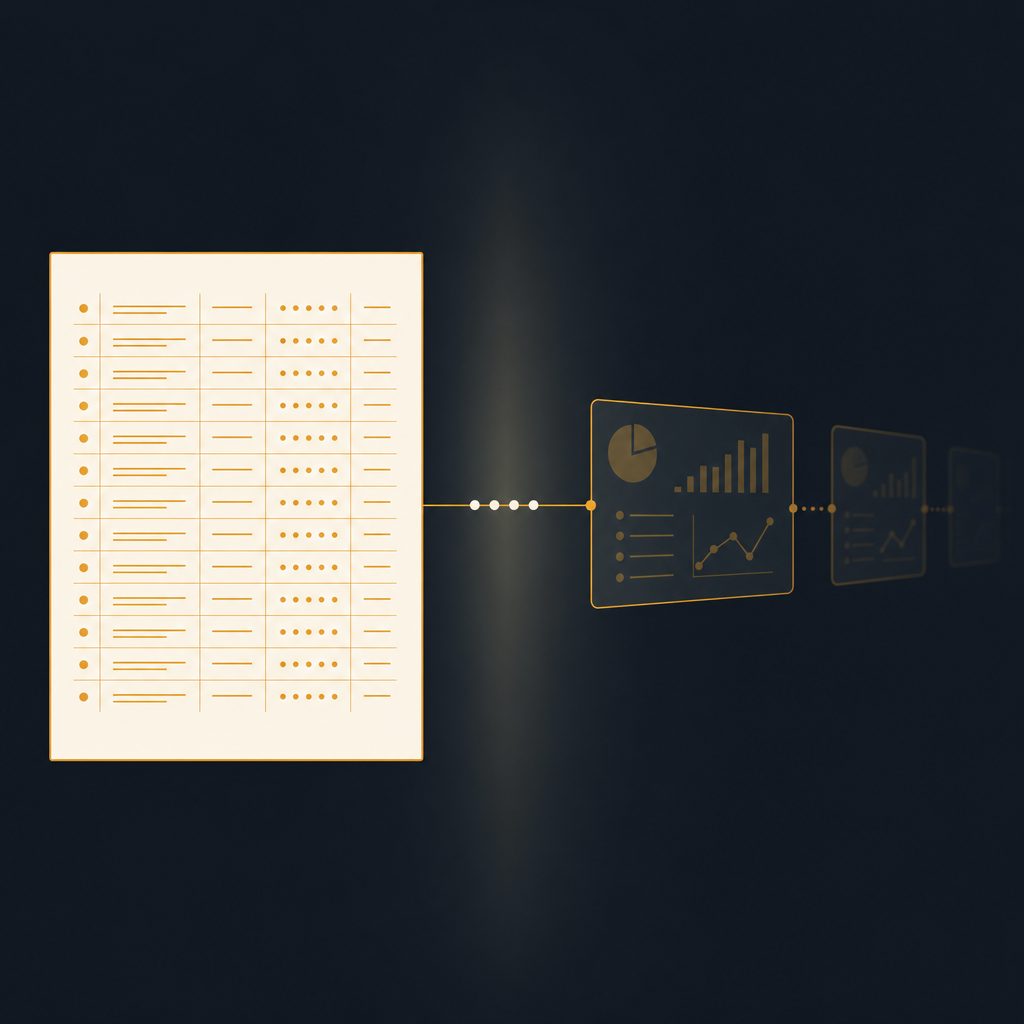
Stop building dashboards. The person who opens a browser tab every morning to look at cloud costs is a habit the software industry trained into us, and that habit is about to be worth nothing, because the consumer of your data is no longer a person.
This is not a developer point. If you work anywhere near software — and in 2026 that is nearly everywhere — you are either building a dashboard, supporting a process, or sitting in meetings gathering requirements so some team can build both. A dashboard of cloud costs. An operations status page. Maybe a room with a wall of screens and people watching numbers scroll. That room exists in the public tours of at least one major cloud provider, and for years it has been empty, because almost everything needed to operate their cloud is automated. The screens show a system that no longer needs a human in the loop. We keep building the room anyway.
Ask the basic question: what is this dashboard actually for? A dashboard is a picture of a dataset. The dataset exists whether or not anyone draws the picture. For years the picture was the only way a person could get value out of the data, so we built the picture first and treated the data underneath as plumbing. That order made sense when the consumer was a human. It doesn’t anymore.
The consumer changed. If you have an agent watching your infrastructure, triaging your alerts, reconciling your invoices, or drafting your weekly status update, that agent does not need a picture. It needs the data. It doesn’t need six tabs. It doesn’t need a pivot table. It needs to know where the data is, what the fields mean, and enough context to act without pinging a human every time it hits something ambiguous. A dashboard for an agent is noise. The dataset for an agent is the product.
So flip the build order. Build the dataset first: a clean, documented, stable feed that anything can read — a person or an agent. Schema, definitions, freshness guarantees, a way to subscribe rather than a screen to poll. If you have budget left over and a genuine human audience that wants to watch it, build the dashboard second, as presentation on top. That’s the extra credit. It’s not the deliverable.
This is already how the industry is moving, well beyond infrastructure. OpenAI shipped Dots in late September — always-on agents with their own cloud computer and browser that hold ongoing responsibilities instead of waiting for a prompt. Stripe is rebuilding its developer surface around agents: an MCP server, a dedicated Agent key type, and — as of October 31 — the MCP server stops accepting secret or restricted keys that aren’t agent-tagged, so old credentials get a 401. The pattern across all of it is the same: expose clean, machine-readable interfaces and let the human supervise instead of operate. The vendors have already decided who their new consumer is.
The uncomfortable part is what this means for the team in the corner cubicle still gathering requirements from customers about what they want to see on screen 4. Every hour of that requirements meeting is an hour spent interviewing a consumer who is being replaced. What the customer actually needs — the underlying numbers, the definitions, the fresh feed — can be delivered without a single pixel of chart. Often the agent that uses your data will be built by someone who never sat in your requirements meetings at all. They’ll find the feed, read the schema, and go. If the data is good they build something valuable with it. If the data is trapped behind a login and a chart library, they build nothing, and your dashboard stays an artifact of the process that produced it.
None of this means dashboards disappear. Humans still make decisions, and a good visualization of a real trend beats a JSON blob for persuasion. But watch where the decisions actually happen. For most operational data — cost, status, incidents, throughput — the decision is increasingly made by software, and the human is the one who reviews the log after. If you’re building for the reviewer, build the log. If you’re building for the decider, build the dataset. The dashboard is a form of marketing for data that already exists. Build the data. Skip the marketing until someone asks.
There’s a simple test for anything you’re about to build this quarter. Ask: if an agent were the only consumer of this, would it still be worth building? If the answer is no — if the whole value of the thing is that a human enjoys looking at it — be honest about that. That’s a nice-to-have with a runtime of one browser tab and the attention of whoever opened it. The dataset underneath has a runtime of years, because every agent that ever touches your company will read it. Build the thing that outlives the tab.
Newsletter
Get the notes by email
New essays and chapter updates, a few times a month. No spam — unsubscribe any time.